Featured Blogs
Understanding Polycystic Ovary Syndrome (PCOS) is key to effective management. This evidence-based PCOS blog provides essential insights for those newly diagnosed or seeking deeper knowledge.
21-Day PCOS Diet Meal Plan (PDF) + Foods to Eat & Avoid List
Download this 21-day PCOS Diet Meal Plan pdf. Plus learn everything you need to make your own PCOS meal plan including a list of foods to eat and avoid.
Read More →
37 PCOS Recipes: Breakfast, Dinner, Grab-n-Go, Dessert, Snack
Get reliable, low-sugar, gluten-free, dairy-free recipes that limit glycemic load. Designed for busy women, with limited time to cook, these are the kinds of recipes you need to take back control of your health and fertility. Put good nutritional principles into practice and beat PCOS.
Read More →
Managing PCOS with Inositol: 13 Expert Tips (Complete Guide)
Inositol is one of the most proven supplements for PCOS. But it’s important to differentiate fact from fiction. This evidence-based guide explains what you need to know about inositol for PCOS.
Read More →Explore the Blog
All Blog Posts
21-Day PCOS Diet Meal Plan (PDF) + Foods to Eat & Avoid List
Download this 21-day PCOS Diet Meal Plan pdf. Plus learn everything you need to make your own PCOS meal plan including a list of foods to eat and avoid.
Read More →
3 Benefits of Berberine for PCOS + Dosage, Safety, Best Brands
Is Berberine right for you? Discover the benefits, dosage, and potential side effects of using berberine for PCOS.
Read More →
Polycystic Ovary Syndrome (PCOS): Symptoms, Causes, and Treatment
PCOS is a common disorder with complex causes. Its symptoms can affect your fertility, hair, skin, and body weight. Discover how to diagnose and successfully manage this syndrome.
Read More →
4 Types of PCOS & How to Determine Yours (Take the Quiz!)
There are 4 types of PCOS. Knowing which one you have can help guide your treatment. Discover one that’s good for all of them.
Read More →
The 15 Best Supplements for PCOS According to Science
Don’t be misled or confused with PCOS supplements that don't work. This short list of the best supplements for PCOS summarizes the latest research.
Read More →
Saw Palmetto for PCOS: A Scientific Review
Curious about Saw palmetto for PCOS? This herbal medicine may be helpful for PCOS, but the quality of evidence and strength of the effect is low.
Read More →
3 PCOS-Friendly Ice Creams – Best Store Brands + Recipes
Know what to look for when searching out PCOS ice cream brands. My recommended products plus PCOS-friendly ice cream recipes.
Read More →
PCOS Natural Treatment – Success Stories from 7 Women
See what’s possible with these PCOS natural treatment success stories. Everyday women achieve life-changing results after switching to a PCOS diet.
Read More →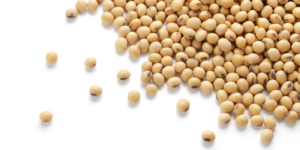
Soy and PCOS: 4 Types to Eat & Which Ones to Avoid
Don’t be misled about the pros and cons of soy and PCOS. Understand the nuances. Know the kinds of soy to eat and which ones to avoid.
Read More →
Metformin for PCOS – 7 Reasons to Avoid it
If you’re trying to lose weight or get pregnant then metformin for PCOS is unlikely to help. Based on the most up-to-date research, experts now advise against its use. Yet, metformin remains one of the most commonly prescribed drugs for women with PCOS.
Read More →
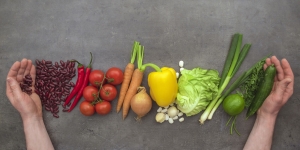
13 Foods to Avoid with PCOS & What to Eat Instead
Discover the most up-to-date information about which foods to avoid with PCOS. Use this comprehensive guide and downloadable checklist to take your PCOS wellness to the next level.
Read More →37 PCOS Recipes: Breakfast, Dinner, Grab-n-Go, Dessert, Snack
Get reliable, low-sugar, gluten-free, dairy-free recipes that limit glycemic load. Designed for busy women, with limited time to cook, these are the kinds of recipes you need to take back control of your health and fertility. Put good nutritional principles into practice and beat PCOS.
Read More →